
Wondering what is going on in the Smyrna Vinings townhome and condo market? Look no further. We’re back to cover the latest sales activity for July. We just saw significant improvement in the Smyrna Vinings homes market, so lets get started with the Smyrna Vinings condo sales figures for July and see how they compare.

As you can see, we’ve been tracking the market for quite some time. We sell a lot of Smyrna Vinings homes, condos and townhomes and one of the major reasons is that we specialize in the area, know the inventory of homes for sale and understand the trends, statistics and all the local pertinent information necessary for you to make an informed decision.
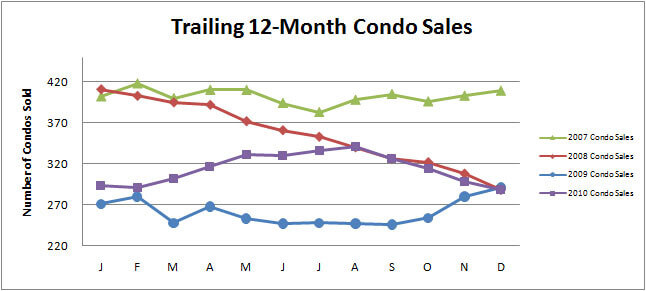
As you’ll notice, the green bar is 2007 and we were selling a lot more condos and townhomes in 2007. Sales dropped continuously in 2008, while 2009 stabilized and picked up in the fourth quarter largely due to the first-time home buyer tax credit. 2010 saw the market peak in the late Spring and Summer. Unfortunately, we’ve seen the Smyrna Vinings condo and townhome market take quite a hit to start 2011, which is not a sign of health right now, but have leveled off in June and July.
One other point to note with the townhome and condo market is that while they’ve been hit harder by short sales and foreclosures, they originally showed a quicker recovery than the single family home market. That recovery in the condo and townhome market has taken a swing in the wrong direction to start 2011.
Smyrna Vinings July condo and townhome sales are at their lowest level in the past five years.

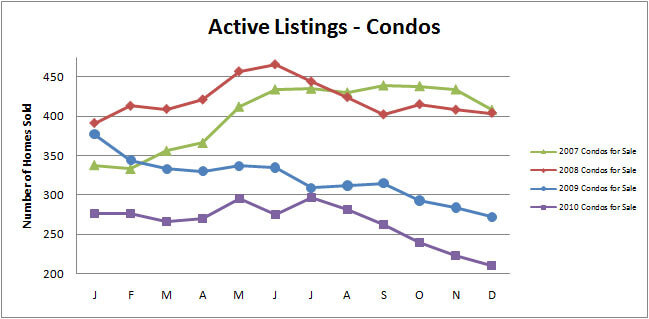
The Active Listings chart depicts Smyrna Vinings condos and townhomes currently for sale. You’ll note that total active listings peaked in 2008, which can be explained based upon sales dropping significantly in 2008, which resulted in Smyrna Vinings townhomes and condos sitting on the market longer. In 2009, we saw the active listings drop significantly and this can be tied to the economic uncertainty, which resulted in a lot less development of new condos and townhomes for sale in the Smyrna Vinings market.
This trend has continued into 2010 and 2011. What we see now in the current market is that active listings are at a lower level in July 2011 than in any of the past five years. One interesting point about this is you have less competition if you want to sell in today’s market. If you’ve thought about selling and just aren’t sure, be sure to contact us or find out how much your home is worth.

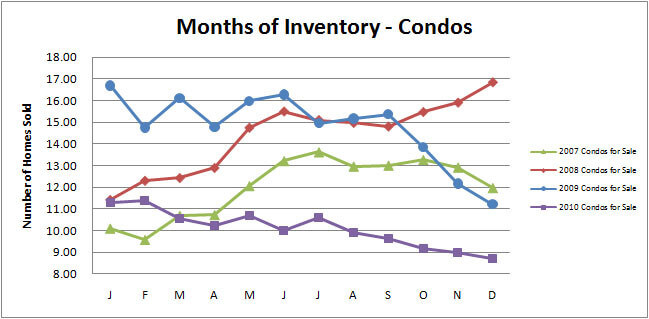
One other important statistic that we like to track is how we gauge the health of the Smryna Vinings townhome and condo market. Months of inventory is a calculation that takes the current amount of homes for sale and divides that by the number of homes that have sold in the last 12 months. What the result means is if no more homes were listed, how many months would it take, based upon the past 12 months activity, to sell all the homes currently for sale. A result of 6 months is considered a healthy market, less than 6 months a seller’s market and more than 6 months, a buyer’s market.
What you can see in the chart above is that we were closest to a seller’s market at the beginning of 2011. The highest amount of bloat and most severe buyer’s market was in January of 2009 with significant improvement coming at the end of 2009 and throughout 2010. Since hitting the lowest months of inventory ratio in January, we’ve seen sales continue to decline in the Smyrna Vinings condo market which has resulted in months of inventory settling in around 12 months for the last two months.
That’s your Smyrna Vinings condo and townhome activity recap for July.
Hope that was helpful and don’t hesitate to contact us if we can help you sell your Smyrna Vinings condo or townhome or find your new Smyrna Vinings townhome or condo. And don’t forget that we offer the most extensive Smyrna Vinings condo and townhome search in the area.
[where: 30080]
[where: 30339]