Smyrna Vinings home sales continue their resurgence from the bloated market of only a few years ago. Who would have imagined that we would see such a remarkable rebound. Alas, there are limits in terms of what we expect from the Smyrna Vinings real estate. At this point, we’re seeing the market stabilizing and a very solid rate. Without more land to develop or more homeowners entering the resale market, this is looking like the new normal for Smyrna Vinings home sales. With US home loan rates remaining low, we expect demand to remain strong and we expect to see a lot of move-up homebuyers taking advantage of the opportunities that 2014 will offer. We’re certainly off to a good start.
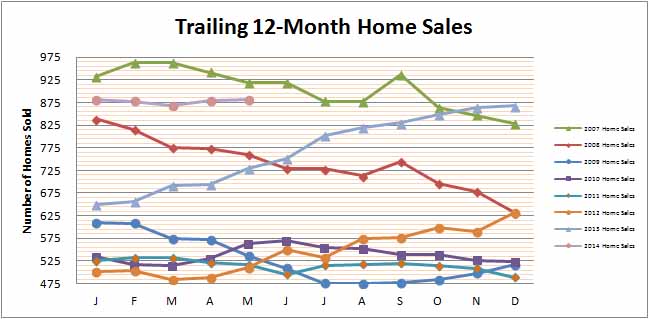
This chart shows you the past 12 months of home sales at any given point. As you’ll notice, the green bar is 2007 and we were selling a fair amount more homes in 2007. Sales dropped significantly in 2008, with the drop becoming more pronounced toward the last quarter of 2008. That would be the beginning of the financial meltdown. 2009 home sales started off about 32% off the level just two years previously in January 2007. We saw Smyrna Vinings home sales continue to drop in 2009, but then leveling off in late summer and actually seeing sales pick up toward the end of the year. Typically, you expect sales to be higher in the late Spring and early Summer, but that hasn’t been the case in 2007-2010.
2014 Smyrna Vinings home sales are certainly consistent. Probably no other period in the past 8 years with such a consistently flat line on our graph. A lot of what that tells us is that supply is modulating actual sales as the demand is certainly there. While nationally there has been some concern about a housing slowdown, we’re definitely not seeing it in the Smyrna Vinings real estate market.
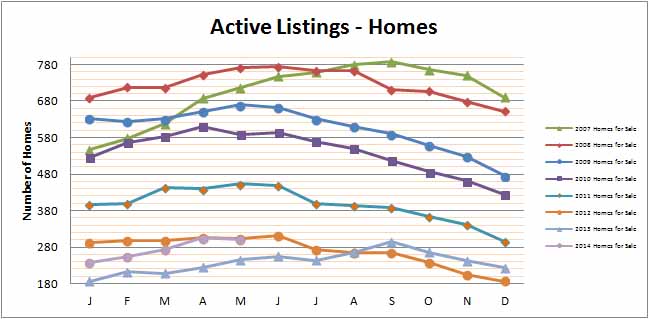
The Active Listings chart depicts Smyrna Vinings homes currently for sale. As a general rule, we’ve seen inventory increase in the April to June range and then see the amount of Smyrna Vinings homes for sale reduce towards the end of the year. While sales and months of inventory numbers vary drastically from previous years, the one thing you can count on is that inventory decreases in the last quarter of the year, as indicated above. The big difference of course is that the overall number of homes on the market is just much less than in years past due to homes selling so quickly.
We’ve seen a slight increase in the number of homes for sale in each month in 2014, which is actually good since inventory levels were and still are at very low levels. Sellers are starting to understand that now is a great time to sell and take advantage of the current market.
As sales are improving, we’re also seeing prices increasing as well. We’re going to continue to see more equity sellers in the market and fewer distressed properties as we move forward over the next couple years. This will result in continued low inventory levels as the number of equity sellers that can afford to sell will be outnumbered by buyers eager to take advantage of prices that are still depressed and interest rates that are phenomenal. If you’ve thought about selling and just aren’t sure, be sure to contact us or find out how much your home is worth. Less competition is a good thing if you’re ready to sell.
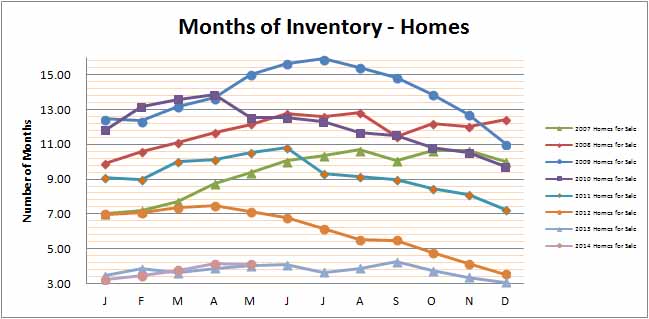
One other important statistic that we like to track is the overall health of the Smyrna Vinings home market. Months of inventory is a calculation that takes the current amount of homes for sale and divides that by the number of homes that have sold in the last 12 months. What the result means is if no more homes were listed, how many months would it take, based upon the past 12 months activity, to sell all the homes currently for sale.
A result of 6 months is considered a healthy market, less than 6 months a seller’s market and more than 6 months, a buyer’s market. What we can see from the chart above is that we have lower inventory levels right now than at any point in the past five years. Compare that with the highest amount of bloat and most severe buyer’s market in July of 2009 with significant improvement starting in mid-2010 and continuing through today.
In May, inventory levels have increased slightly from the end of 2013, but are tracking very closely with last year. As prices have increased this year, we have seen a big pickup in new construction and an increase in resale activity as more home owners can afford to sell. Technically, we continue to work in a seller’s market based on current inventory levels. What this means as you will continue to see prices slowly rise from here as demand outpaces supply.
That is your Smyrna Vinings homes sales activity recap for May 2014. Hope that was helpful and don’t hesitate to contact us if we can help you sell your Smyrna Vinings home or find your new Smyrna Vinings home.
Click here if you’d like to know what your Smyrna Vinings homes is worth.
Click here to start your Smyrna Vinings home search.
[where: 30080]
[where: 30339]
[where: 30082]
[where: 30126]


